/Blog%20Featured%20Image%20Icons/compare-with-crosstabs.png)
Anytime that you need to do a side-by-side comparison of how different groups of respondents answer your survey questions, cross tabulations are an extremely handy analysis tool that compares the relationship between two questions within a survey. Cross-tabulations essentially provide a different view of your survey results that help to understand the differences (and/or similarities) in responses from separate groups of people.
With total responses, it can be difficult to see trends and relationships across different variables when your responses aren't aggregated in any particular way. We got a lot of valuable feedback from our core customers that showed there was a need for the ability to dig deep into their most important survey responses and uncover relationships across variables – which is why we're so excited to announce that cross-tabulations are now available for deeper insights into their data.
What can I do with crosstabs?
Understanding how variables in a survey are related to one another helps to illustrate if there's a relationship in whether one response changes or affects the response to the other question. Say you had the following question:
- Is there a relationship between office location and job satisfaction?
Then, consider the following example of how crosstabs can help to answer your questions above:
You've sent off a simple, two-question survey that asks for 1) job satisfaction and 2) what location they work at. Your overall results show that in general, all employees of varying office locations feel generally satisfied with their job and there seems to be no readily apparent trend among the less-than-average responses from the naked eye. However, you do have a hunch that there is a correlation between office location and job satisfaction – that in the bigger, metropolitan cities, employees feel more satisfied with their job.
To explore this, you then create a cross-tabulation with the two opposite options selected for the job satisfaction question: whether that's 1 and 5, 1 and 10, agree and disagree, or however your poll is set up. For the location, you opt to choose all responses. From the crosstabs, you'll figure out very quickly whether your original hypothesis is correct or incorrect.
How does cross tabs work in Polly?
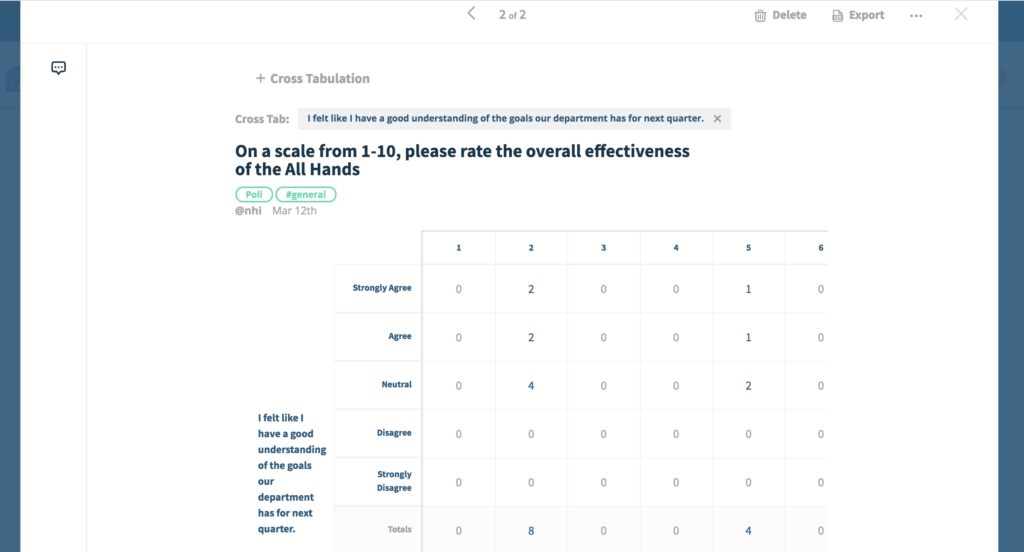
In Polly, creating crosstabs is actually simpler than it sounds, although it's only available to access from the survey detail view – similarly to applying filters. Right next to the Filter button on your survey of choice, is the Cross Tabulate button. Since you need two variables to compare, this works best for surveys that have at least two questions, as long as they are not two open-ended questions. You can, however, compare an open-ended question with a multiple choice question.
If you wanted to drill into a single cell to see comments that match that cell, then you can do that by clicking on it (coming soon!). In terms of selecting response options to compare, the default is that all responses to the comparison question will be included – but you will soon be able to cherry pick the responses you wish to include!
Where can I find more information?
Have questions, or interested in learning more about what you can unlock with crosstabs in Polly? Visit our help pages on crosstabs where we (hopefully) answer everything there is to know about crosstabs.
Not sure how to get started with cross tabs for your team or organization? Check out our step-by-step guide to using crosstabs.
As always, we're more than happy to help! Just drop us a line at contact@polly.ai and we'll get back to you in no time.