/Blog%20Featured%20Image%20Icons/10-hr-metrics.png)

In this post, you’re going to cover some of the key metrics most successful organizations across the world track and work to improve.
You’ll also learn:
- Why each of these metrics matter
- how to gather and calculate the metrics yourself
- Simple ways you can use that data to improve
Let’s get started!
Why HR Metrics Matter
As HR leaders cement their positions as strategic business partners at the executive table, the metrics they track and share with other members of senior leadership become crucial. In order for “key HR metrics” to be valued as “key business metrics,” it’s important to know your audience, as Mark Feffer explains in his recent SHRM article:
“To demonstrate how workforce measures can impact the bottom line, HR professionals must meld those metrics with business data.”
So how do you know you’re tracking the right metrics for your team, your organization, and your counterparts in leadership?
Getting the Most from Your Data
Modern society is fixated on numbers and grading. We measure, grade, and rate everything, from movies to businesses and chicken eggs. Most of us graded and rated in a number of ways from the moment we’re born.
That fixation can lead you to track metrics with minimal strategic application.
It’s crucial to keep in mind what our goal is for HR metrics and ask ourselves how they serve us, our goals, or our organizations.
To maintain focus, we’re going to outline a number of metrics and how to track them, but in doing so we’ll also be exploring why you might want to track them, and as Feffer stressed, how you can apply the learnings strategically.
Of the HR metrics examples we’ll cover, there are two main categories.
- The first category we’ll call passive metrics, which you can gather without direct input from individual employees.
- The second category we’ll call active metrics, which require participation from your team to gather.
Passive Metrics
Some HR metrics are objective and simpler to calculate because they don’t require direct input from employees or any advanced interpretation beyond the results they provide, even if they may require a bit of digging to find.
These metrics can be powerful though, whether they’re being used as a simple litmus test or the goalpost for an ongoing initiative. The drawback to metrics like these is their tendency to provide a somewhat blunt perspective when reviewed in a vacuum.
Profit / revenue per employee
Profit (or revenue) per employee is a simple metric that you can apply to any business whose revenue and employee counts you have at hand.
Why track this?
Profit per employee can be useful to senior leadership as a high-level check on workforce efficiency and financial performance in comparison with other similar organizations.
How to calculate revenue per employee:
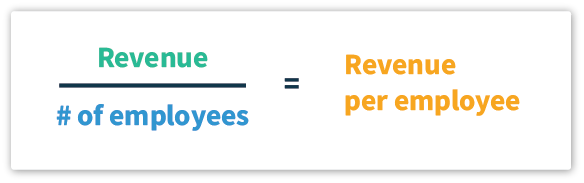
This is as simple as it gets: take your organization’s revenue and divide it by the number of employees. For an organization with $3 million in revenue with 300 employees, the revenue per employee metric would be $10,000.
What to do with the data
Many publicly traded companies share this data, and as such, it can be used as a set of benchmark. For that reason, profit (or revenue) per employee is a common high-level benchmark used by CFOs, as a loose proxy for an organization’s relative efficiency and performance in comparison with other similar organizations.
If your profit or revenue per employee is drastically lower than that of a similar organization in your industry, it may be a sign that your workforce could benefit from some additional support.
While it might seem as though this metric is of little use in a vacuum, you can still leverage it to track your progress toward greater organizational efficiency by measuring current results against your past results.
Employee Turnover
Employees are the beating heart of any organization. As such, employee turnover rate is one of the most important HR metrics you can track, but like many of these metrics, it’s most useful with context.
Why track this?
Knowing the rate of employee turnover can help you to understand and gauge effectiveness of leadership at every level of your organization.
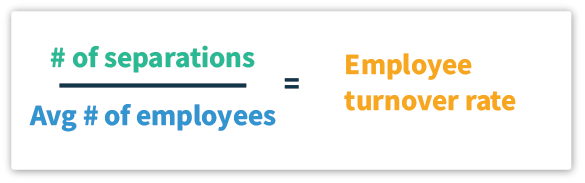
How to calculate employee turnover rates
Take a given timespan -- one year, for example -- find the average number of employees active during that time. Divide the number of separations (voluntary and involuntary) during that time by the average number of employees. Multiply the results by 100 to get your employee turnover percentage.
What to do with the information
There are several ways to look at employee turnover. The simplest and most generalized is turnover in aggregate across your organization. This is a useful measurement of overall leadership effectiveness.
Knowing where you sit among other similar organizations on this metric can be helpful, but the most important comparison is the delta between your own past measurements and your current measurement.
Review in aggregate
Turnover in aggregate speaks to leadership and culture in aggregate. If your overall turnover rate is significantly higher than other similar organizations and it’s not improving between measurements, there may be a systemic leadership issue to address.
Separate into cohorts
By separating employee turnover rates into specific cohorts, you can learn how more granular departmental culture and leadership are influencing turnover, and what impact they have on the larger aggregate score.
If, for example, a statistically high turnover rate exists for one department -- or one leader -- while the rest are good or nominal, that can be a useful piece of data in determining where focused improvements can be made in leadership.
Once you know your employee turnover rate and have a sense of where it stems from, you can take steps to improve it, and measure the results of those actions. If the results are positive, you’ve found an area of investment where you can make a positive impact for your team.
Elective Churn Rate
All employees leave given a long enough timespan, no matter how close-knit your organization is. There are myriad reasons for an employee to leave, and those reasons matter.
If an employee leaves because they’ve retired and their position isn’t going to be backfilled, that’s usually classified as attrition. If they’re let go, that’s turnover. If an employee leaves because they’ve found a different place to lend their skills, that’s also considered turnover, but it can be viewed as a specific segment of turnover: elective churn, or E-Churn.
Why track this?
Your elective churn rate is another vantage point with to track alignment -- or misalignment -- in your organization at the highest level. Employees who leave of their own accord are leaving for a reason. That reason might be compensation, culture, or a number of other reasons, some of which you’ll have more control to work on.
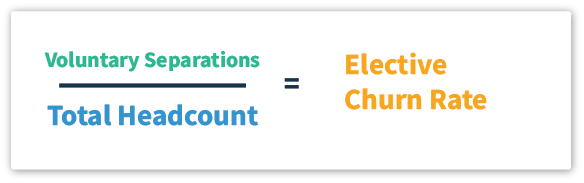
How to calculate elective churn
Take the number of employees who have voluntarily left, and divide it by the total number of employees you’ve hired since day one.
So, for example: If three employees choose to leave an organization with a total of 50 employees who have been onboarded in its history, the elective churn rate is six percent:
(3 / 50) * 100 = 6% elective churn rate.
What to do with this information
Your goal is to keep your elective churn rate as low as possible.
A consistently low or declining elective churn rate is a sign that your team is well aligned with your organizational culture and goals.
If elective churn is on the rise, there’s a good chance there’s misalignment between your organization’s culture and its constituents. Use this measure to evaluate your culture at a high level and how it evolves over time.
Time to Fill (Recruiting)
Why track this?
Time to fill is an important component in both your hiring process and the cost of turnover. It’s important to remember that different roles take longer to fill than others. The same is true for geographic locations and a number of other factors.
These key differences are why it can be helpful to know industry benchmarks, but important to measure your success by improvements made relative to your own historical data.
How to calculate time to fill

This is a simple metric to calculate -- just take the average time a given position (or category of position) is open to the point that it closes. It’s often most useful to take the median time to fill, rather than the mean or mode to accommodate for outliers in the process. So for example:
Time (in days) to fill:
9, 10, 10, 11, 12, 12, 12, 14, 15, 17, 33
What to do with the data
Once you know your average time to fill a position, you can compare against industry averages, across departments, or across your own historical results. The sooner you have this measurement in place, the richer and more useful your data will be.
If you find that the time it takes for you to fill a similar position has increased over time, it’s a sign to take a look at the factors that can influence your results.
Compensation, culture, location, your interview process, and the depth of your talent pool are just a few factors that can impact time to fill.
Time to Productivity (Ramping)
Time to productivity is one of the most difficult HR metrics to track because in many cases, productivity is inherently subjective. While there are some professions like assembly line work where productivity can easily be measured, the majority of work, especially knowledge work, is notoriously hard to quantify.
For example: what does it mean to be a productive software engineer -- the number of lines you can crank out in a given day? Not if code never passes review and any that does breaks or ends up needing a refactor within a few months. Does a successful writer measure their productivity by the number of words they publish, or by the substance of those words? But how do you measure the substance?
There’s a lot of room for nuance here. Oftentimes, you’ll settle on a rubric that provides a benchmark. That rubric may evolve over time, but it can be a big step to have one at all.
Why track this?
Knowing your average time to productivity, even if it’s still a little fuzzy, can help determine if your hiring and onboarding processes are effective. You can also learn a great deal about the effectiveness of individual managers, and put initiatives in place to improve both.
How to calculate time to productivity
Before you can calculate time to productivity, you must establish your organization’s rubric for what it means to reach productivity. This is by far the most difficult part of measuring time to productivity.
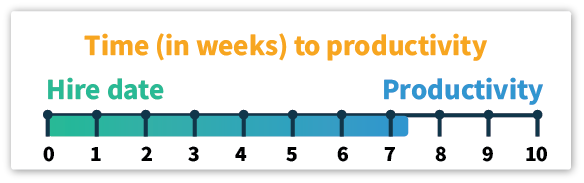
Once you’ve landed on an evaluation framework, the hard part is over. All that’s left is calculating the time it takes a new employee to reach that level by dividing the number of days since their start date until the day they’ve achieved the benchmark you’ve established.
[Number of workdays from date of hire → date in which satisfactory productivity reached = time to productivity]
What to do with the data
You can use time to productivity to zero in on which parts of your employee experience, and which stages of your employee lifecycle are humming along, and which need work.
For example: if time to productivity is dramatically different between direct reports of one manager over another in the same functional area, it’s a good indication that the manager in the poorer performing cohort could benefit from training.
Conversely, if both manager cohorts are similar, the problem may be with the hiring or onboarding process. If similarly leveled employees reach that benchmark at dramatically different rates, but with the other variables (manager, hiring) being ostensibly similar, the performance issue may be specific to that individual.
The Cost of Employee Turnover
Why track this?
The cost of employee turnover is a significant (and often avoidable) costs an organization pays throughout its lifespan.
Believe it or not, no matter how you measure the cost of turnover, there’s a good chance it’s still more costly than you think, due to its impact on things like:
- Employee morale
- Employee workloads
- Institutional knowledge
- Productivity
How to calculate the cost of employee turnover
A good employee can usually return your investment on their salary, plus an additional factor, which depends on a host of influences. It may be different in your organization, but for our purposes, let's call it a factor of two. In addition to that lost revenue, there are costs associated with each hire. If you’re tracking some of the metrics we’ve covered earlier, you’ll already have some of these in hand.
Average employee salary - revenue generated by employee
- Average cost of hiring
- Average revenue generated by employee * Time to fill
- Average revenue generated by employee * Time to productivity
Multiply the total by your turnover rate in a given timeframe, and you’ll have a conservative cost estimate for that period. You could apply this math to subsets of a workforce, like engineering or sales to get a more accurate representation of what turnover in that department costs.
It’s important to remember that this is not the only way to calculate this metric, and there may be some factors in your organization that lend themselves to a different measurement. If this math feels complicated to do by hand, or if you want some additional perspective, there are spreadsheets and calculators dedicated to determining turnover costs, specifically. Each of these calculators have their own slightly different way of calculating cost of turnover. Pick one that works best for you.
What to do with the data
Once you have a handle on what employee turnover is costing your organization, you can speak more effectively to the bottom line impact of culture initiatives. If you have an initiative in place that has reduced turnover (or aims to), this framework can be valuable in determining if it's working, and where your efforts and resources are best spent.
Active Metrics
There are some metrics you simply won’t be able to gather on your own, no matter how hard you dig for them. They require the active participation of others in your organization.
Historically, these metrics have been difficult to gather because traditional surveys were the only practical method. While the data collected from surveys is valuable, their deployment tends to be cumbersome, they’re often seen as a distractive external process by respondents.
As a result, traditional survey response rates and the quality of responses suffer. This often led to organizations tracking them less frequently, less effectively, or not tracking them at all.
The key to gathering these active metrics effectively is a continuous, contextual feedback loop that is integral to the work respondents are already doing.
Wish there was a tool for that?
We'd love to show you how Polly can help you gather this crucial data automatically in Slack and Microsoft Teams.

Employee Net Promoter Score (eNPS)
Net Promoter Score (NPS) was first introduced as a simple measure of a customer’s affinity for a brand or product. Since its introduction NPS has been deployed by many of the world’s most successful organizations.
Unsurprisingly, a similar measure can be a powerful tool to track employees’ affinity for their organization. Enter, eNPS.
Why track this?
Just like a product experience, the relative positivity of your employee experience is something that can be measured on a 1-10 range. While this measurement in itself isn’t all you need to know about your workforce, it can be a useful datapoint in evaluating your employee experience without demanding much extra time or effort from your team.
How to calculate eNPS
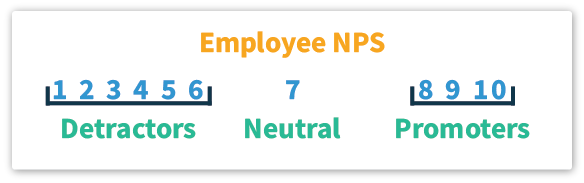
Send a poll to employees, asking on a 1-10 scale, how likely they are to recommend your organization to friends and family as a great place to work.
Respondents who scored your organization “eight” or above would be considered promoters; a “seven” or less is likely a sign that there are some issues in the employee’s experience that need attention.
For greater accuracy, this data is best collected anonymously. Make it clear that trends will be reviewed, rather than individual scores so that employees can feel comfortable giving candid feedback.
What to do with the data
eNPS is a perfect example of the kind of continuous feedback loops you can use to improve your employee experience, and resultantly, your organization’s performance.
Job Satisfaction
Job Satisfaction is the fulfillment an employee derives from their work. There are many factors involved in job satisfaction -- compensation, camaraderie, and work-life balance being a few of the most common.
Why track this?
Knowing at a high level how satisfied employees feel at work can provide some priceless insights into the alignment between your team’s motivating factors and their experience at work.
How to calculate job satisfaction
It may seem as though job satisfaction is a bit too fuzzy to measure as a single metric -- and in most cases, it is. That’s why it can be useful to measure job satisfaction as a combination of 1-10 scores.
For example:
I feel as though my efforts are compensated sufficiently.
1 (strongly disagree) ← → 10 (strongly agree)
There are a number of key factors that contribute to job satisfaction; however, there are likely a few that you have more direct influence over, and those will likely be different factors in different organizations.
Let’s build a job satisfaction score based on a few of the above metrics:
Camaraderie score + compensation score + job duties score / total possible points * 10
[(8 + 6 + 9) / 30 ] * 10 = 77%
What to do with the data
Start by finding which factors you have the most power to improve, and measure those. Combine them to measure satisfaction in aggregate, and review individual scores to determine which areas you can most improve in.
Once you know where you can make the most impactful improvement, you can start making progress toward building a more satisfying employee experience.
Leadership Approval
Employees have traditionally been expected to earn the approval and esteem of those in leadership, but it’s equally important for leaders to do the same for those they lead. That mutual respect and esteem is crucial to building sustained engagement.
Why track this?
The senior leaders of your organization are also its culture leaders. Their actions are a visible embodiment of your values in action. When leadership actions align with the individual values employees bring to work, and those they are encouraged to exhibit, it strengthens and reinforces the team.
The same is true of middle leadership as well. If senior leaders are shining examples of your ideal organizational culture, but line managers don’t reflect those values at all, employees get mixed signals as to which values are truly important in your organization.
How to calculate leadership approval
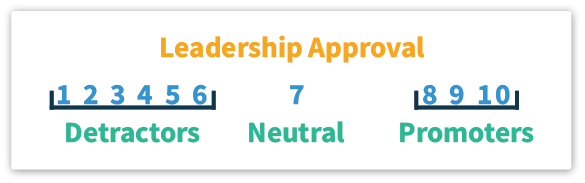
Leadership approval can be calculated on a 1-10 scale, again, similar to an NPS score. Scores averaging seven or above are a sign that approval is satisfactory or better. Sores of six or below would indicate there’s reason to dig deeper.
For example:
I believe [my manager] reflects our organizational values in his daily actions.
(strongly disagree) 1 ← → 10 (strongly agree)
I believe [CEO] reflects our organizational values in her daily actions.
(strongly disagree) 1 ← → 10 (strongly agree)
What to do with the data
Measuring leadership approval at different levels individually and combining those scores into an index can both provide priceless insights into leadership effectiveness.
It might come as a shock to some that their approval rating is lower than expected, but remember, lower than expected scores are simply key areas for improvement -- some of which may be low-hanging fruit.
Employee Engagement Index
Employee engagement is separate from employee satisfaction or happiness, though they’re often conflated. Engagement is more accurately described as an employee’s emotional investment in their organization’s goals, mission, and culture.
Satisfaction, leadership approval and overall happiness can absolutely factor in, though. That’s why it can be helpful to look at them as elements of engagement, rather than proxies for it.
Why track this?
Employee engagement is one of the most influential factors in the success of an organization, because it has the potential to impact everything from productivity to operating margin.
Engagement is a notoriously difficult, moving target to study -- let alone influence -- so much so that a burgeoning industry has developed around it.
How to calculate employee engagement
Engagement is a multifaceted issue, and for that reason, calculating employee engagement differs from some of these other metrics.
Rather than plotting a single data point across time, it’s often more helpful to measure engagement as an index across several individual metrics -- many of which we’ve covered above.
For the purposes of this guide, we’ll keep measurements quantitative, but it’s important to remember that there are a number of additional qualitative measurements that can provide truly valuable information and guidance.
Total employee engagement score / Total possible employee engagement score = Engagement Index Score
What to do with the data
Once you have a baseline engagement index score, you can begin to improve it. Even strong employee engagement can be improved, though in some cases, maintaining a strong score can be an equally valuable endeavor. It all depends on your organization.
For example: you may have stronger engagement than most organizations, but that doesn't mean there’s no reason to improve further.
In conclusion
HR metrics can be powerful tools, helping to improve many areas of your organization from efficiency to culture and bottom line results. The key is to gather metrics you can act on strategically, gather them continuously in the context of the body of work they're meant to measure, and remember that the most important factor is not how you compare to others, but how much you've improved since your last measurement.


/Internal%20Comms%20Fun%204.png)